 Hangga Aji Sayekti
I first got into Android development back when Java was the only way to build apps. Super boilerplate-heavy. Every little thing required so much code just to get it working. Then Kotlin came along as an official option, and I started experimenting with it. Honestly, at first it didn’t feel like a big deal. But over time, I realized I was reaching for it more and more. The syntax just made sense. Less clutter, easier to read, and going back to fix stuff later didn’t feel like punishment.
After a while, I started messing around with backend stuff for fun little side projects. I was already comfortable with Kotlin, so I figured, why learn something new? That’s when I found Ktor, this lightweight framework for building async servers. It just clicked. Deployment ended up being easier than I expected, too. I came across DigitalOcean’s App Platform, which handles all the infrastructure for you. You basically wrap your app in a container, push it, and bam, your API is live in minutes. No stressing about servers or scaling.
But there’s always that one little thing that bugs you. For me, it was cold starts. We’re only talking a couple of hundred milliseconds before your server wakes up enough to handle requests. But when you’re running services that should respond instantly, that tiny delay is annoying. The JVM has to load everything up, get the runtime ready, and only then can it actually do something. It’s not the end of the world, but it’s like that one squeaky door in your house. Small, but you notice it every time.
So finally, I got curious enough to look into it. I wanted to see how much of that startup time I could actually cut down.
In this article, I’ll walk through how I investigated cold starts in a simple Kotlin Ktor service deployed on DigitalOcean App Platform, and experiment with a few approaches to reduce startup latency. By the end, you’ll have a clearer idea of what actually impacts cold start performance and what trade-offs are involved.
Key Takeaways
- JVM cold starts can be noticeably reduced for Kotlin APIs by optimizing both the application artifact and runtime configuration.
- Reducing the application JAR size significantly improves startup behavior because the JVM has fewer classes and metadata to load during initialization.
- Dependency minimization and removing unused transitive dependencies help shrink the runtime footprint and reduce class loading overhead.
- Disabling certain Kotlin runtime assertions can slightly reduce bytecode size and initialization checks during startup.
- Switching the server engine from Netty to CIO Engine can further reduce cold start latency for lightweight APIs.
- After applying these optimizations, the Kotlin API can be deployed efficiently to DigitalOcean App Platform using a container image workflow.
Investigating the Startup Behavior
Before attempting any optimizations, the first step was to understand what actually happens during application startup.
Measuring startup time directly in a cloud environment can introduce additional variables such as network latency or platform orchestration. To keep the experiment controlled, the investigation was performed locally.
                         Start Kotlin API
                                │
                                ▼
                         Observe Startup Logs
                                │
                                ▼
                         Measure Startup Time
                                │
                                ▼
                         Establish Baseline
Running the application locally made it easier to repeatedly start and stop the service while observing the startup logs. This also allowed configuration changes, such as adjusting dependencies or switching server engines, to be tested quickly without waiting for a full deployment cycle.
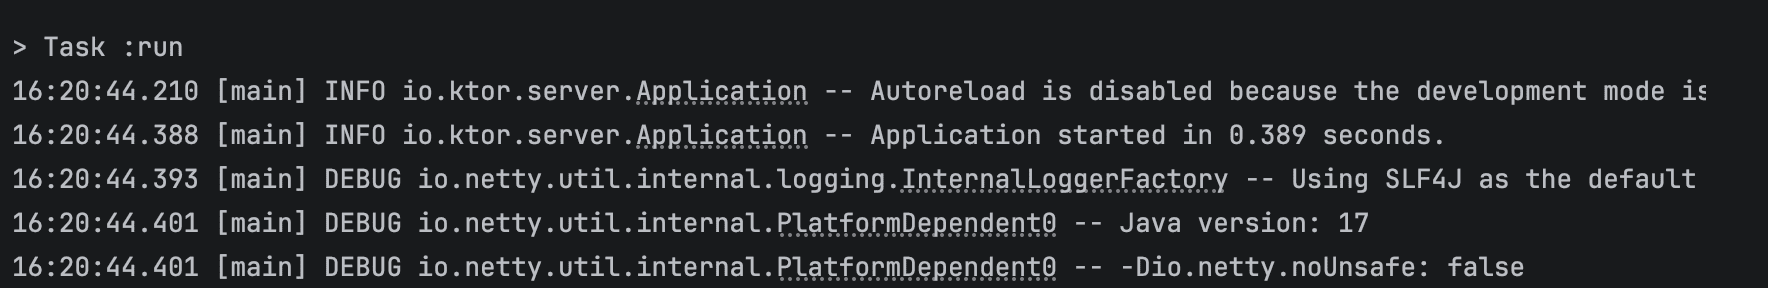
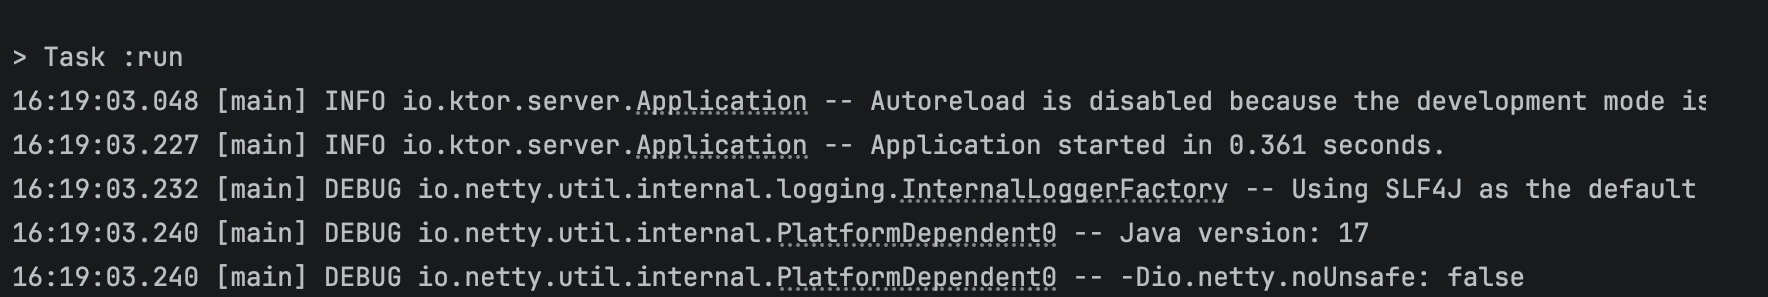
To make the observations more concrete, startup time was measured from process launch to the point where the server was ready to accept requests. The test was repeated multiple times to account for variability.
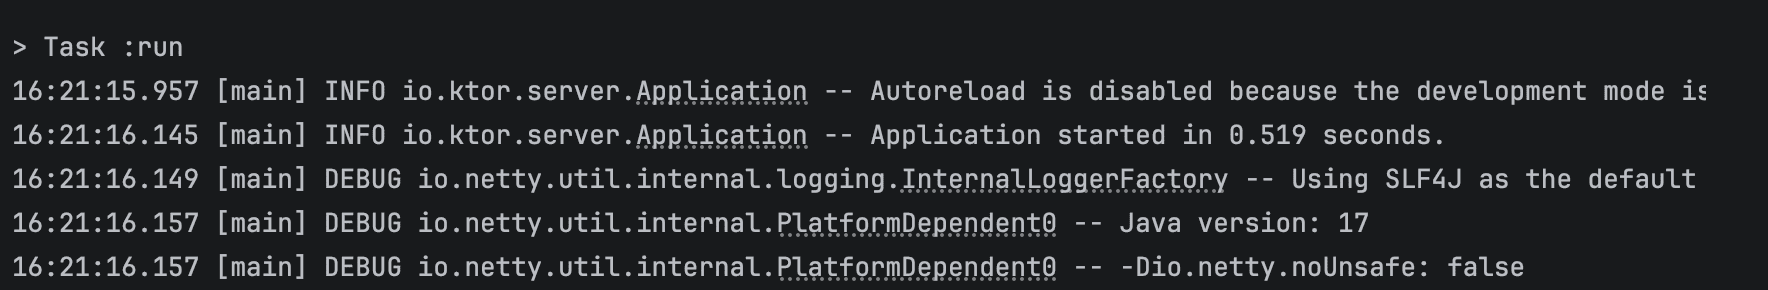
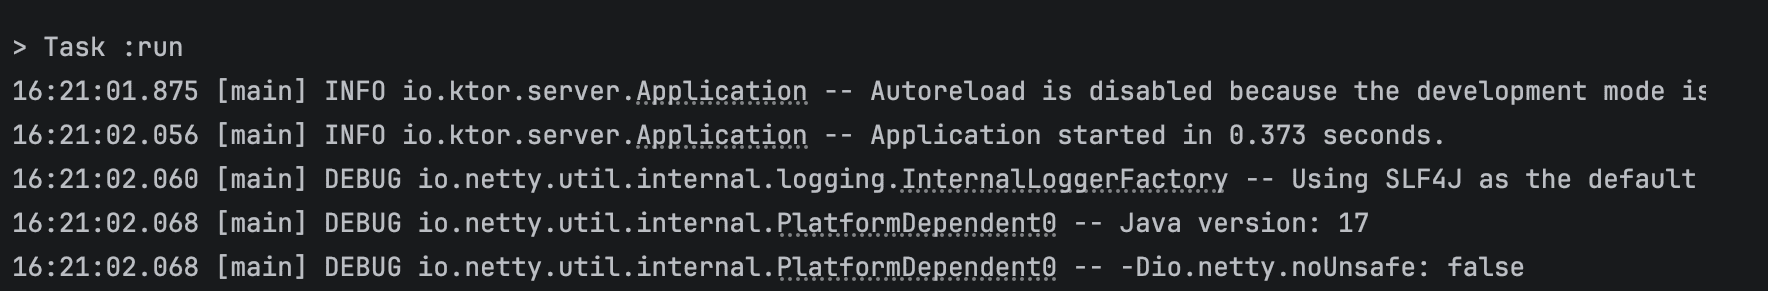
Across four runs, the startup times were recorded as 519 ms, 373 ms, 389 ms, 361 ms, resulting in an average of approximately 410 ms.
From a technical perspective, this startup phase includes several JVM-level operations such as class loading, bytecode verification, JIT warm-up, and dependency initialization within the Ktor application. Based on the logs, a noticeable portion of the time was spent during application module initialization and engine startup.
This baseline provided a clear starting point to evaluate whether further optimizations could meaningfully reduce startup latency.
The goal at this stage was simple: establish a baseline startup time and identify where improvements might be possible.
Sample Projects
To make the experiments easier to follow, the sample application used in this article is available on GitHub.
The project is a small Kotlin API built with Ktor. The service itself is intentionally simple. The goal is not to build a complex application, but to observe how the framework, dependencies, and server engine affect startup behavior.
The API exposes a single endpoint that retrieves cryptocurrency price data from an external service. Internally, the request flows through a small set of components that handle routing, asynchronous processing, and external API communication.
The request and response payloads are also serialized as JSON. This is intentional, since JSON serialization typically requires additional initialization at startup, such as loading serializers, reflection metadata, or data mappers. Including this step makes the startup behavior closer to what many real-world APIs experience. JSON serialization can noticeably affect startup time because the library and serializers must be loaded and initialized before they can be used. JVM class loading and dependency resolution are known contributors to initial cold start latency (IJARPR study).
Community experience also shows that the first JSON serialization or deserialization is often slower than subsequent calls, as the JVM performs class loading and optimizations during that first execution (Kotlin Slack discussion).
Additionally, in Ktor, enabling JSON serialization involves loading plugins and generated serializers, which adds to the runtime initialization overhead (Ktor docs).
The application runs with the following setup:
- Runtime: Java 17
- Language: Kotlin
- Framework: Ktor
- Build Tool: Gradle
- Packaging: Executable JAR (ShadowJar)
- Server Engines Tested: Netty and CIO
Each optimization discussed later in this article is implemented as a separate variant of the project. This makes it easier to compare configurations and observe how changes such as dependency reduction, build configuration adjustments, and server engine selection affect startup time.
The simplified architecture of the sample service is illustrated below:
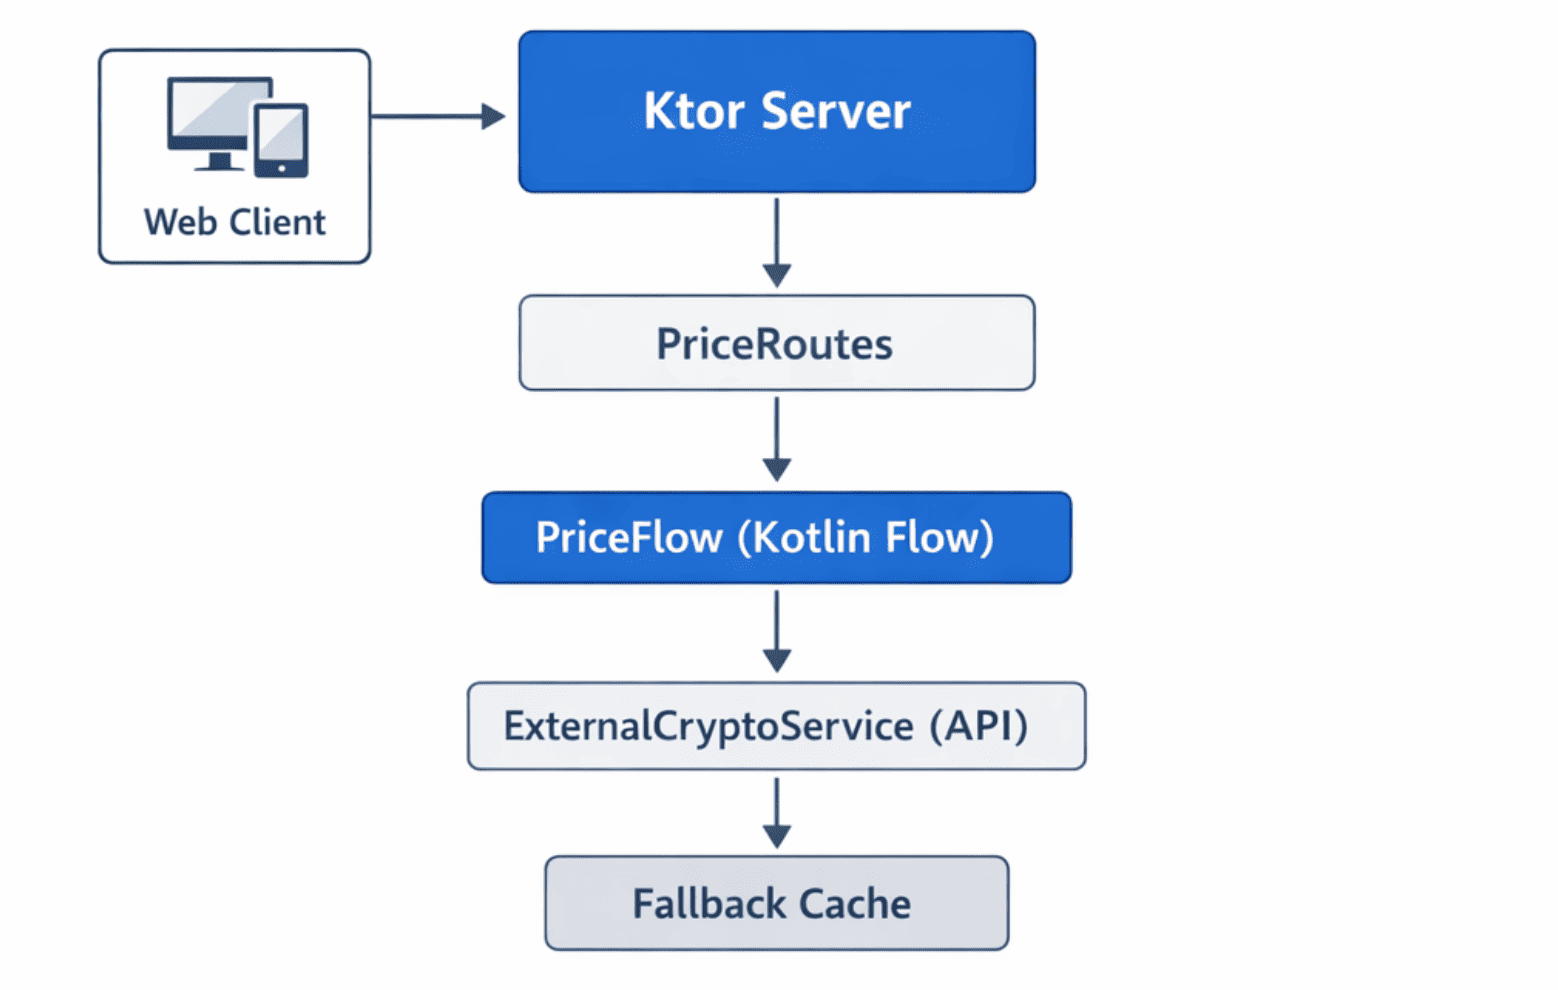
Although the architecture is simple, it is sufficient to demonstrate how dependency footprint, runtime configuration, and server engine choices influence the cold start behavior of a Kotlin API.
Measuring the Baseline Startup Time
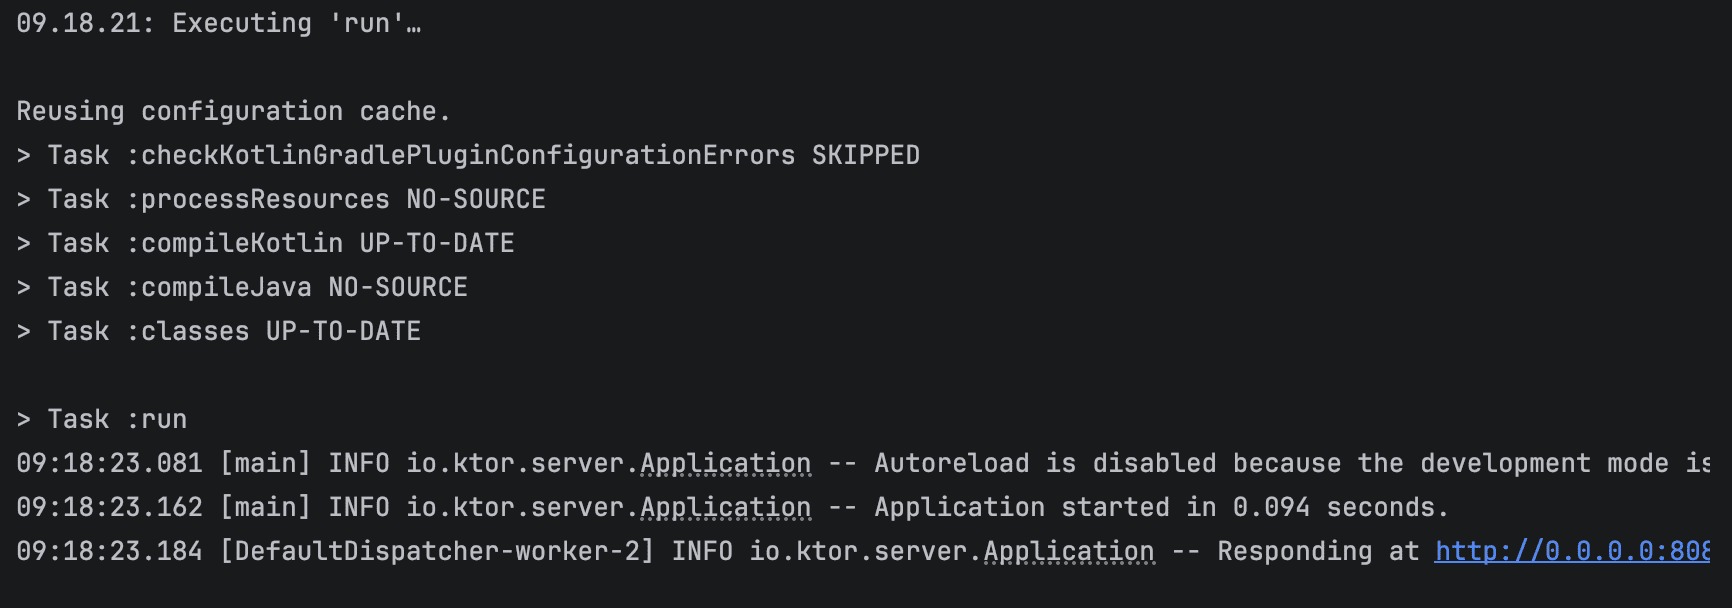
We measured startup time from the moment the JVM process started until the server reported it was ready to accept requests. Since the API is built with Ktor, we can observe this moment directly in the startup logs.
Test Run 1
Test Run 2
Test Run 3
Test Run 4
I ran the startup four times. This number of runs was enough to reliably represent the typical behavior of cold starts while keeping the measurements practical and manageable.
Summary
| Test Run | Startup Time (s) |
|---|---|
| 1 | 0.519 |
| 2 | 0.373 |
| 3 | 0.389 |
| 4 | 0.361 |
Fast enough to sip a coffee, yet just slow enough to make you twitch impatiently, silently wondering why the JVM can’t be ready instantly.
Even small delays like these can be noticeable for tiny services that are meant to respond immediately, which is exactly why cold start becomes such a nagging little problem.
Optimizing the Cold Start
Before touching frameworks or runtime settings, I wanted to see how much work the JVM was actually doing during startup.
Since classpath size has a direct impact on startup time, the first step was obvious: trim down the application’s dependencies.
Reducing the JAR Size
The application was packaged as a fat JAR using the Gradle Shadow plugin. While this simplifies deployment, it also bundles all runtime dependencies into a single archive, which can include libraries that are not fully used.
For a small service, this can unnecessarily increase the number of classes the JVM must load during startup.
To reduce this overhead, several adjustments were made to the Shadow configuration.
These changes led to measurable improvements in both JAR size and startup time, detailed further in the Optimization Results section.
Enabling Dependency Minimization
The first step was enabling the minimize() feature provided by the Shadow plugin. This option removes unused classes from bundled dependencies.
tasks.shadowJar {
    archiveBaseName.set("crypto-monitor")
    archiveClassifier.set("")
    archiveVersion.set("")

    minimize {
        exclude(dependency("io.ktor:.*"))
        exclude(dependency("org.jetbrains.kotlinx:.*"))
        exclude(dependency("ch.qos.logback:.*"))
    }

    mergeServiceFiles()
}
Some dependencies were excluded from minimization because they rely on dynamic class loading or service discovery.
These included:
- Ktor
- Kotlin Coroutines
- Logback
Removing Unnecessary Transitive Dependencies
Another source of unnecessary classes came from transitive dependencies.
For example, when adding Resilience4j, an additional SLF4J API dependency was excluded because the application already included its own logging setup.
implementation("io.github.resilience4j:resilience4j-core:$resilience4jVersion") {
    exclude(group = "org.slf4j", module = "slf4j-api")
}
Removing redundant dependencies helps reduce the overall classpath size.
Excluding Unused Terminal Libraries
Another small cleanup involved removing the Jansi library.
Jansi is typically used for colored terminal output, but it is not necessary in most containerized environments.
configurations.all {
    exclude(group = "org.fusesource.jansi")
}
While the impact of this change alone is small, every removed dependency helps reduce the class loading workload during startup.
Reducing Kotlin Runtime Assertions
By default, the Kotlin compiler generates runtime checks for certain conditions, such as verifying that non-null parameters are not passed as null. While these checks improve safety, they also introduce additional bytecode that runs during method calls.
Since this service is relatively small and already well-tested, I disabled two of these assertions to slightly reduce the amount of generated runtime code.
kotlin {
    compilerOptions {
        freeCompilerArgs.add("-Xno-param-assertions")
        freeCompilerArgs.add("-Xno-call-assertions")
    }
}
These flags instruct the compiler to skip generating runtime checks for parameter nullability and call-site assertions.
The impact on startup time was relatively small compared to the server engine change, but removing unnecessary runtime checks can still help reduce the amount of work the JVM performs during application initialization.
Analyzing the Dependency Footprint
After reducing the dependency footprint and simplifying the generated bytecode, the startup time improved slightly. However, inspecting the dependency tree revealed another factor that might have a larger impact: the server engine.
To understand what the application was loading at runtime, I inspected the dependency tree using Gradle:
./gradlew dependencies --configuration runtimeClasspath
The output revealed the full set of libraries included in the runtime classpath.
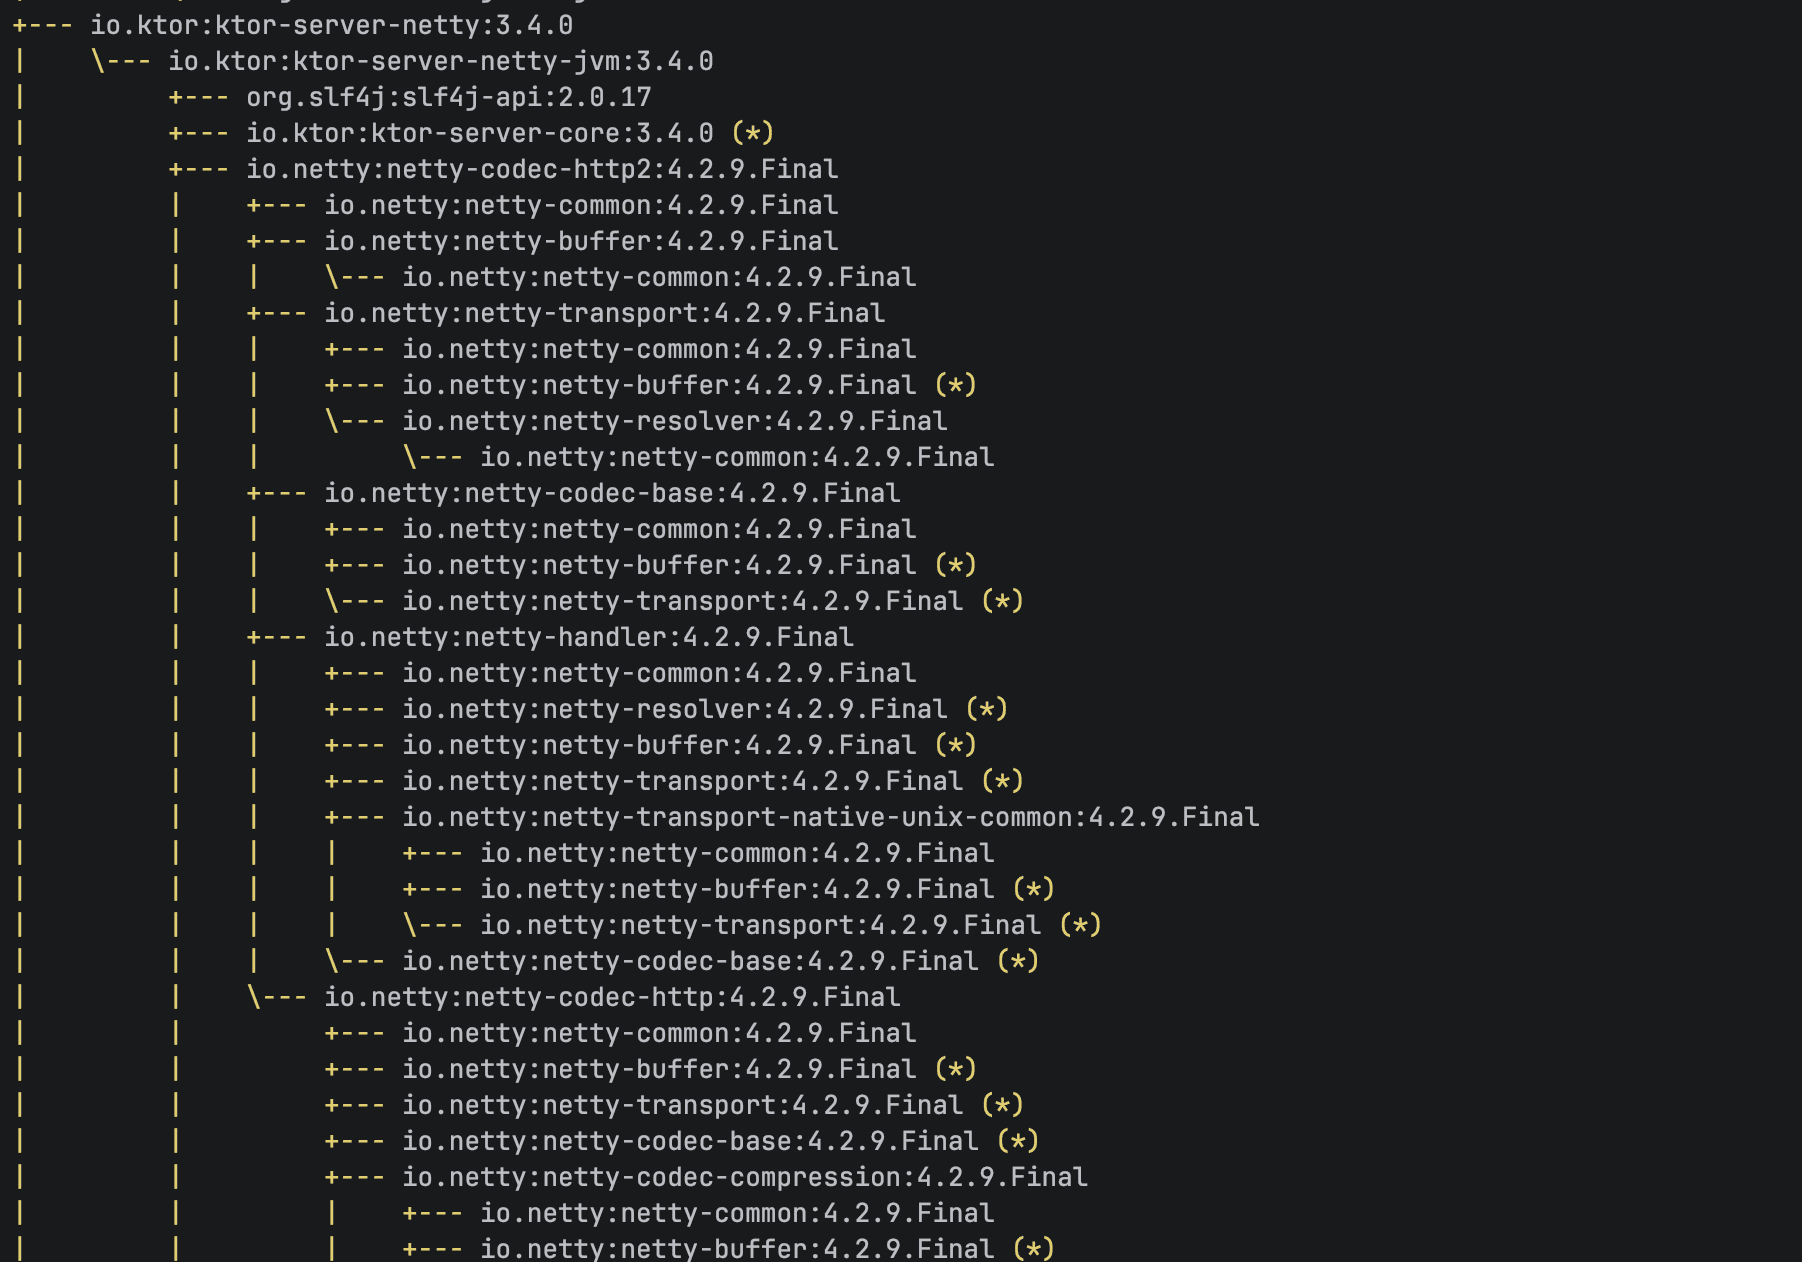
One component stood out immediately: the Netty server engine used by Ktor.
Netty is fast and battle-tested, but it also brings along quite a few supporting modules. For large production systems, that overhead is barely noticeable. But for a tiny API trying to start as quickly as possible, it got me thinking:
What if a lighter server engine could start faster?
Switching the Server Engine
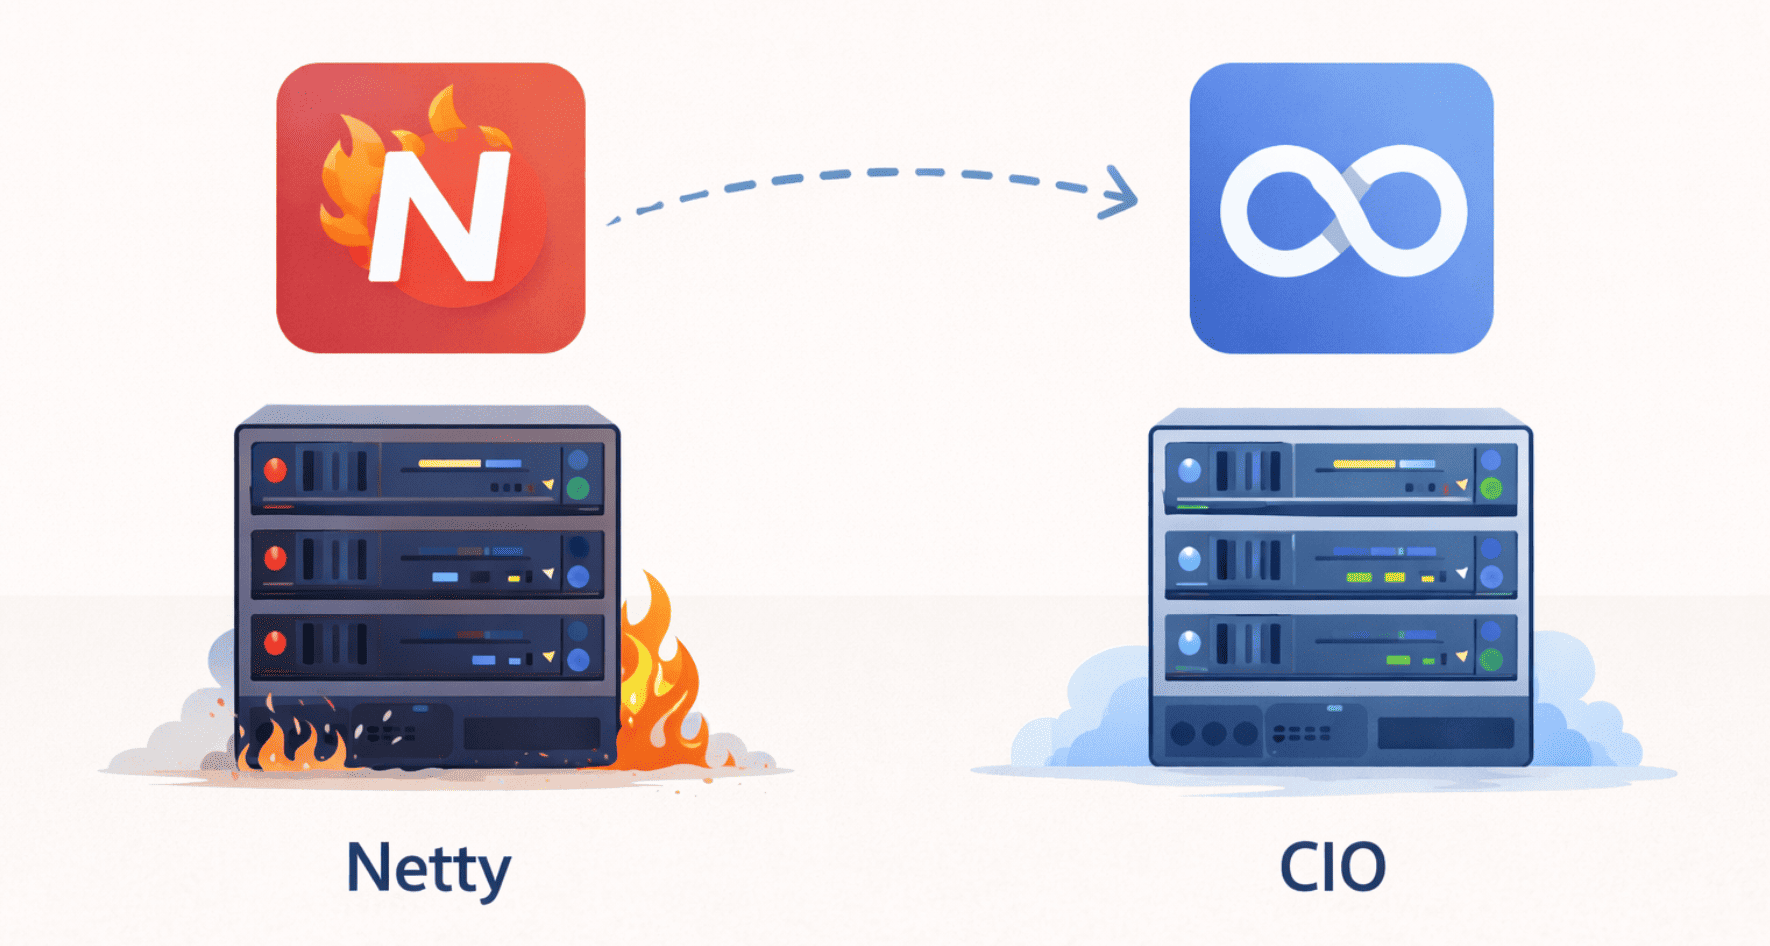
Ktor supports multiple server engines, including Netty and CIO (Coroutine-based I/O).
Netty is widely used in high-performance JVM servers, while CIO has a smaller dependency footprint and is built directly on top of Kotlin coroutines.
Switching between the two turned out to be surprisingly simple and only required a small change in the application startup code.
Before (Netty):
embeddedServer(Netty, port = port, module = Application::module)
    .start(wait = true)
After (CIO):
embeddedServer(CIO, port = port, module = Application::module)
    .start(wait = true)
After making the change, the application was rebuilt and the startup measurements were repeated.
Optimization Results
Before looking at startup performance, it’s worth checking how the earlier optimizations affected the application artifact. In particular, the JAR became smaller and lighter, which helps explain why later changes, such as switching the server engine, can impact startup time.
Before
After
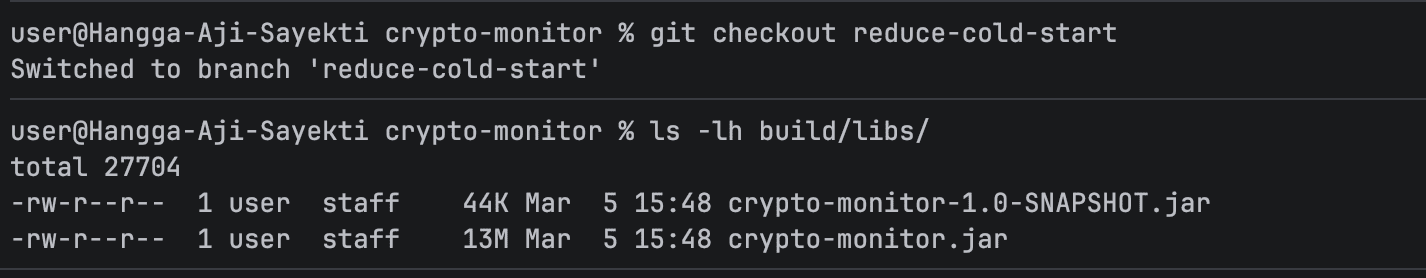
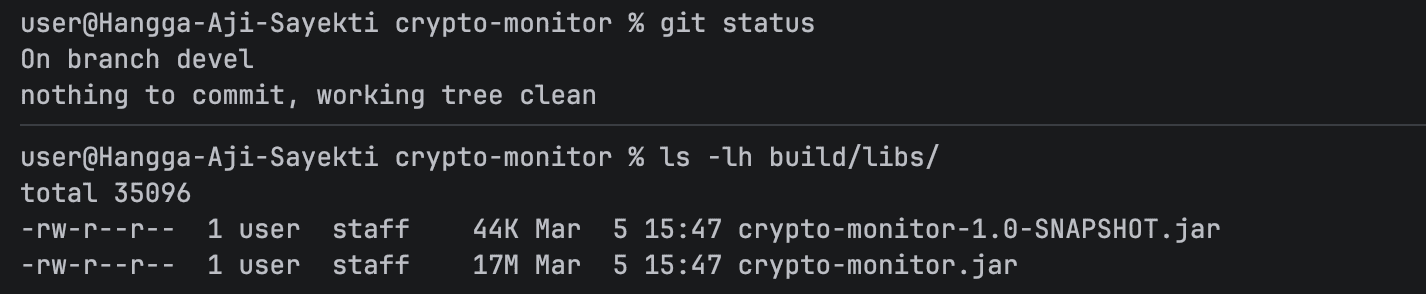
After enabling dependency minimization and removing several unnecessary transitive dependencies, the size of the executable JAR decreased from 17 MB to 13 MB.
| Build Configuration | JAR Size |
|---|---|
| Baseline build | 17 MB |
| After dependency minimization | 13 MB |
While reducing the artifact size does not automatically guarantee faster startup, it can reduce the amount of bytecode the JVM needs to scan and load during initialization.
With the optimized build in place, the next step was measuring the startup time using different server engines.
The following results were collected from four startup runs.
Test Run 1

Test Run 2
Test Run 3

Test Run 4

| Test Run | Before (s) | After (s) |
|---|---|---|
| 1 | 0.519 | 0.083 |
| 2 | 0.373 | 0.094 |
| 3 | 0.389 | 0.073 |
| 4 | 0.361 | 0.077 |
| Average | 0.410 | 0.082 |
The difference was noticeable right away.
On average, the startup time dropped from 410 ms to about 82 ms, which is roughly an 80% improvement.
For large, long-running services, this might not seem like a big deal. However, for a small API that is expected to start quickly, especially in environments where instances may restart or scale frequently, this reduction can make a real difference.
Another interesting observation is that the application code itself did not change. The improvement came entirely from switching to a lighter server engine with a smaller initialization footprint.
Visual Comparison
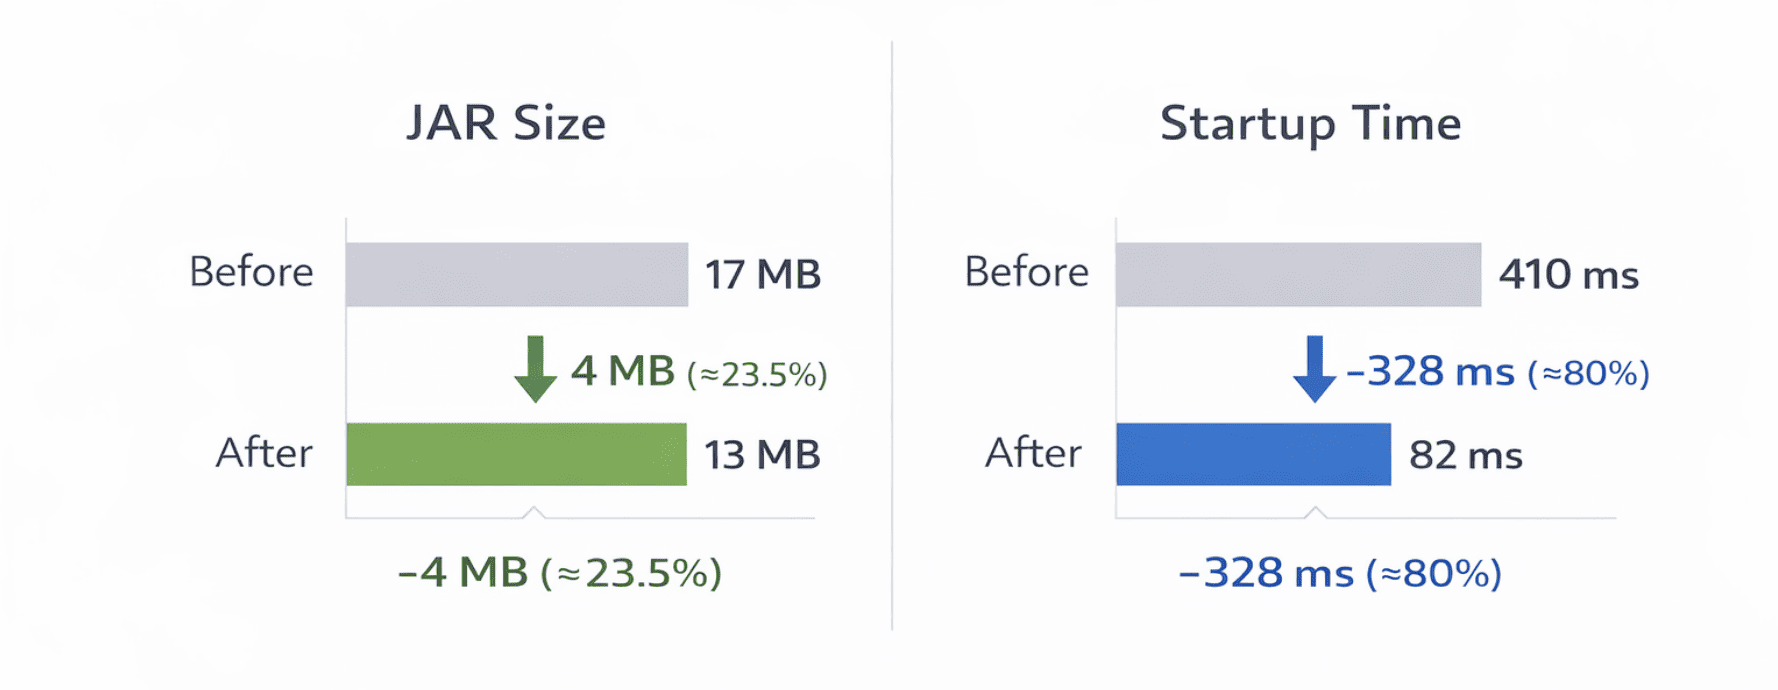
Seeing the results was genuinely satisfying. Reducing the JAR from 17 MB to 13 MB and cutting startup time from 410 ms to 82 ms made the API feel instantly snappier. Those small wins, like a lighter dependency footprint and a faster server engine, make working on Kotlin services really rewarding. Now we can approach deployment with much more confidence, knowing the API starts quickly and efficiently.
Deploying to DigitalOcean App Platform
Once the startup optimizations looked good locally, it was time to see how the service behaved in the cloud. The API was packaged into a Docker container and deployed to DigitalOcean App Platform.
App Platform handles infrastructure, scaling, and runtime management automatically, so there’s no need to configure servers manually. All it needs is a container image.
From there, the process was simple: write a Dockerfile, build the image, push it to Docker Hub, and create the application in App Platform.
Writing the Dockerfile
To run the application on App Platform, it must first be packaged as a container image. This is defined using a Dockerfile.
In this project, a multi-stage Docker build is used. The first stage compiles the application and produces a fat JAR file, while the second stage contains only the runtime needed to execute it. This approach keeps the final image smaller and reduces unnecessary build tools in production.
# =========================
# Stage 1: Build
# =========================
FROM eclipse-temurin:17-jre-jammy AS builder

WORKDIR /app

# Copy all files
COPY . .

# add permission
RUN chmod +x ./gradlew

# Build fat jar
RUN ./gradlew shadowJar --no-daemon

# Generate CDS archive (improves startup)
RUN java -Xshare:dump -jar build/libs/crypto-monitor.jar || true

# =========================
# Stage 2: Runtime
# =========================
FROM gcr.io/distroless/java17-debian12

WORKDIR /app

COPY --from=builder /app/build/libs/crypto-monitor.jar app.jar

# Cloud-friendly port
ENV PORT=8080

EXPOSE 8080

# Run as non-root (security best practice)
USER nonroot

# JVM optimized for fast startup
ENTRYPOINT ["java","-XX:+UseContainerSupport","-XX:MaxRAMPercentage=75","-XX:+TieredCompilation","-XX:TieredStopAtLevel=1","-XX:+UseSerialGC","-Xshare:on","-jar","app.jar"]
A few details in this configuration are worth pointing out.
The first stage compiles the application using Gradle and produces a fat JAR via the Shadow plugin. It also attempts to generate a Class Data Sharing (CDS) archive, which can help reduce JVM startup time.
The second stage uses a distroless Java runtime. Distroless images strip away unnecessary system tools and libraries, resulting in a smaller and more secure runtime environment.
The container runs as a non-root user and includes several JVM options that favor faster startup and lower memory usage, which works well for lightweight API services.
With the Dockerfile in place, the container image can then be built locally.
Building the Docker Image
Once the Dockerfile is ready, the container image can be built locally.
docker build -t crypto-monitor .
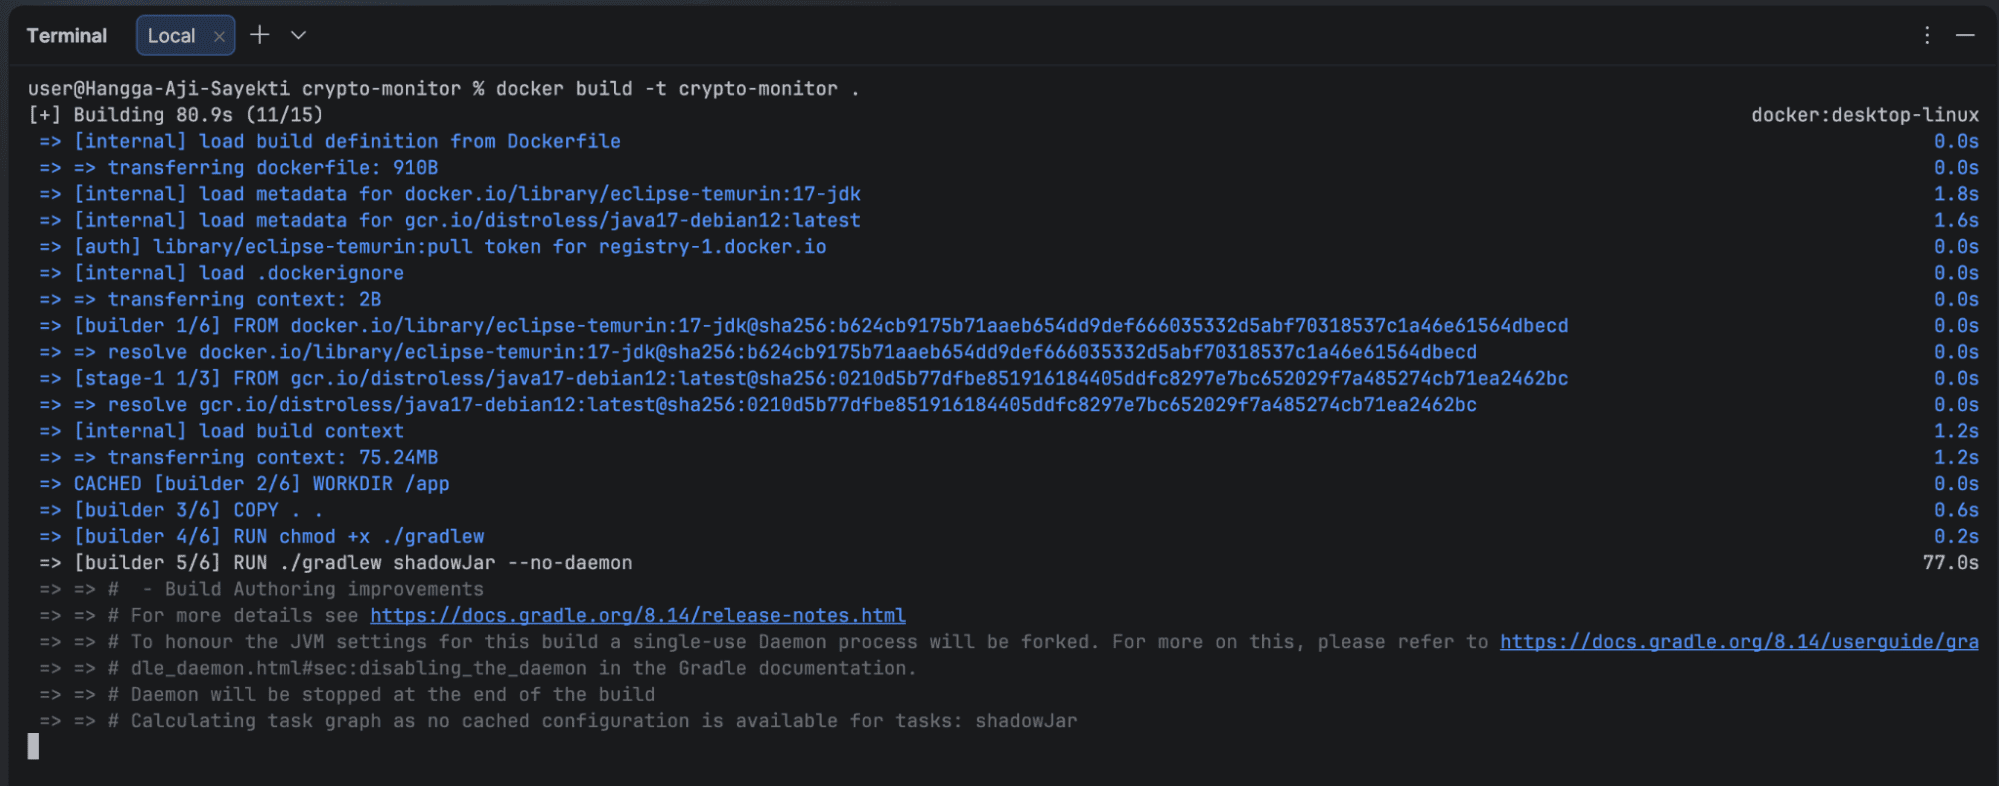
The resulting image packages the application into a portable runtime environment that can be deployed anywhere Docker containers are supported.
Pushing the Image to Docker Hub
To make the image available to App Platform, it was uploaded to Docker Hub.
docker tag crypto-monitor bazeniancode/crypto-monitor:0.1
docker push bazeniancode/crypto-monitor:0.1
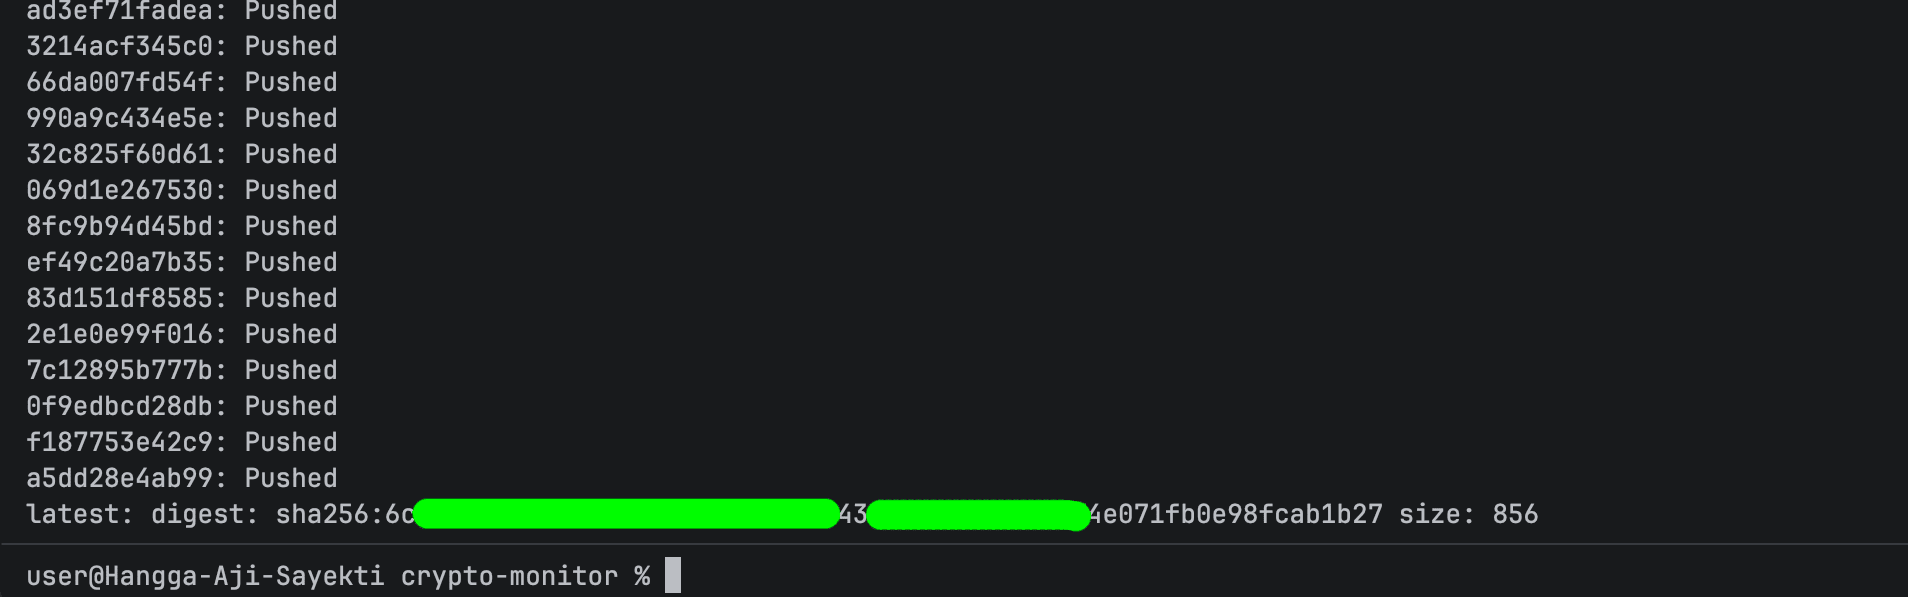
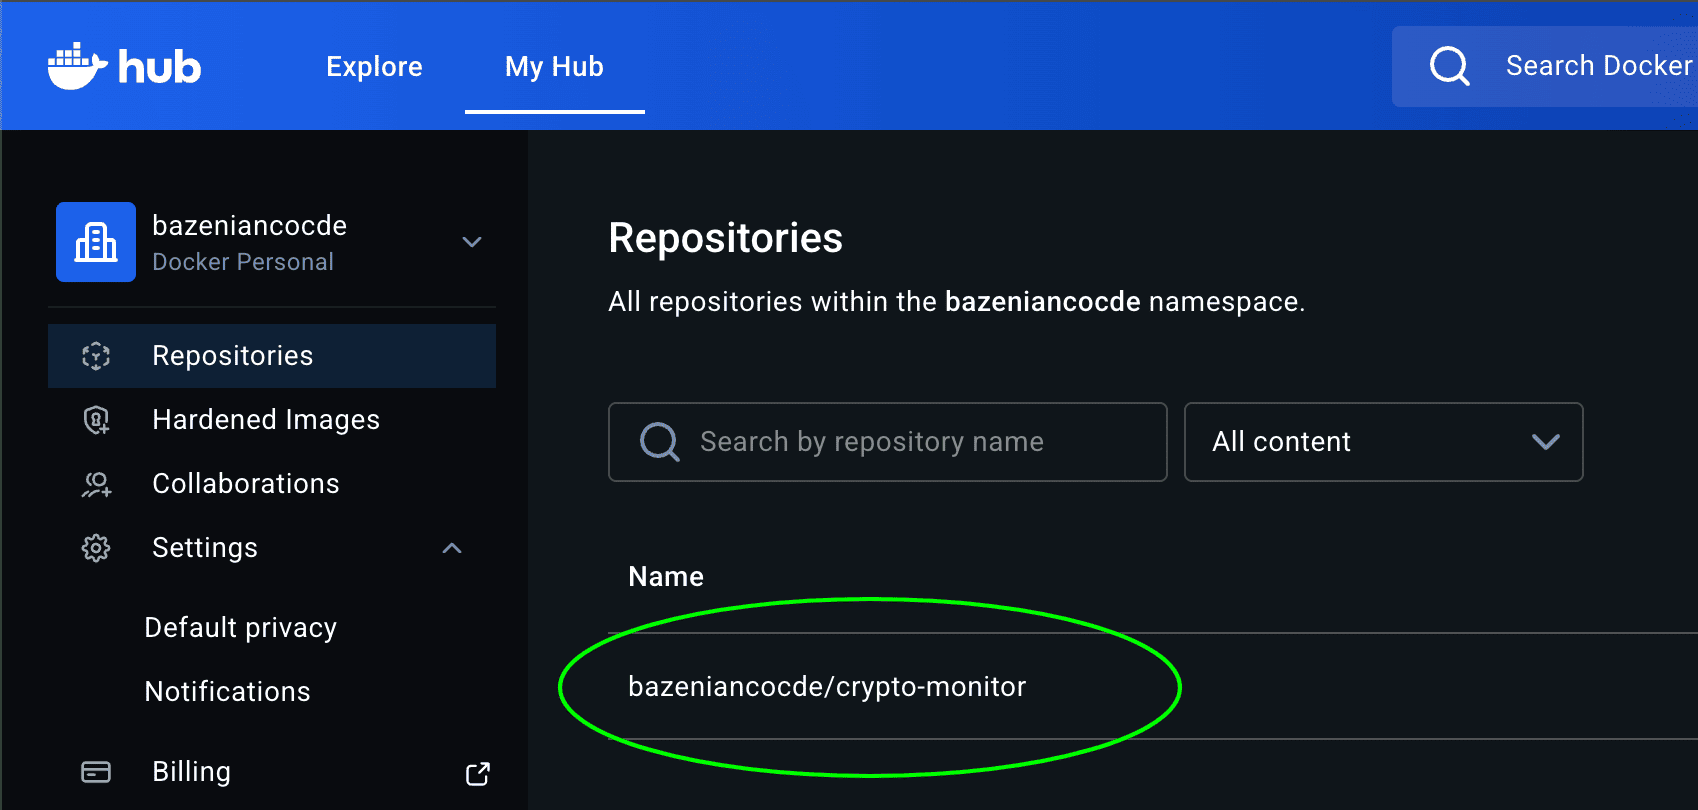
After the upload completes, the image can be referenced directly during deployment.
Creating an App on DigitalOcean App Platform
DigitalOcean App Platform supports several deployment sources, including Git repositories, container images, and templates.
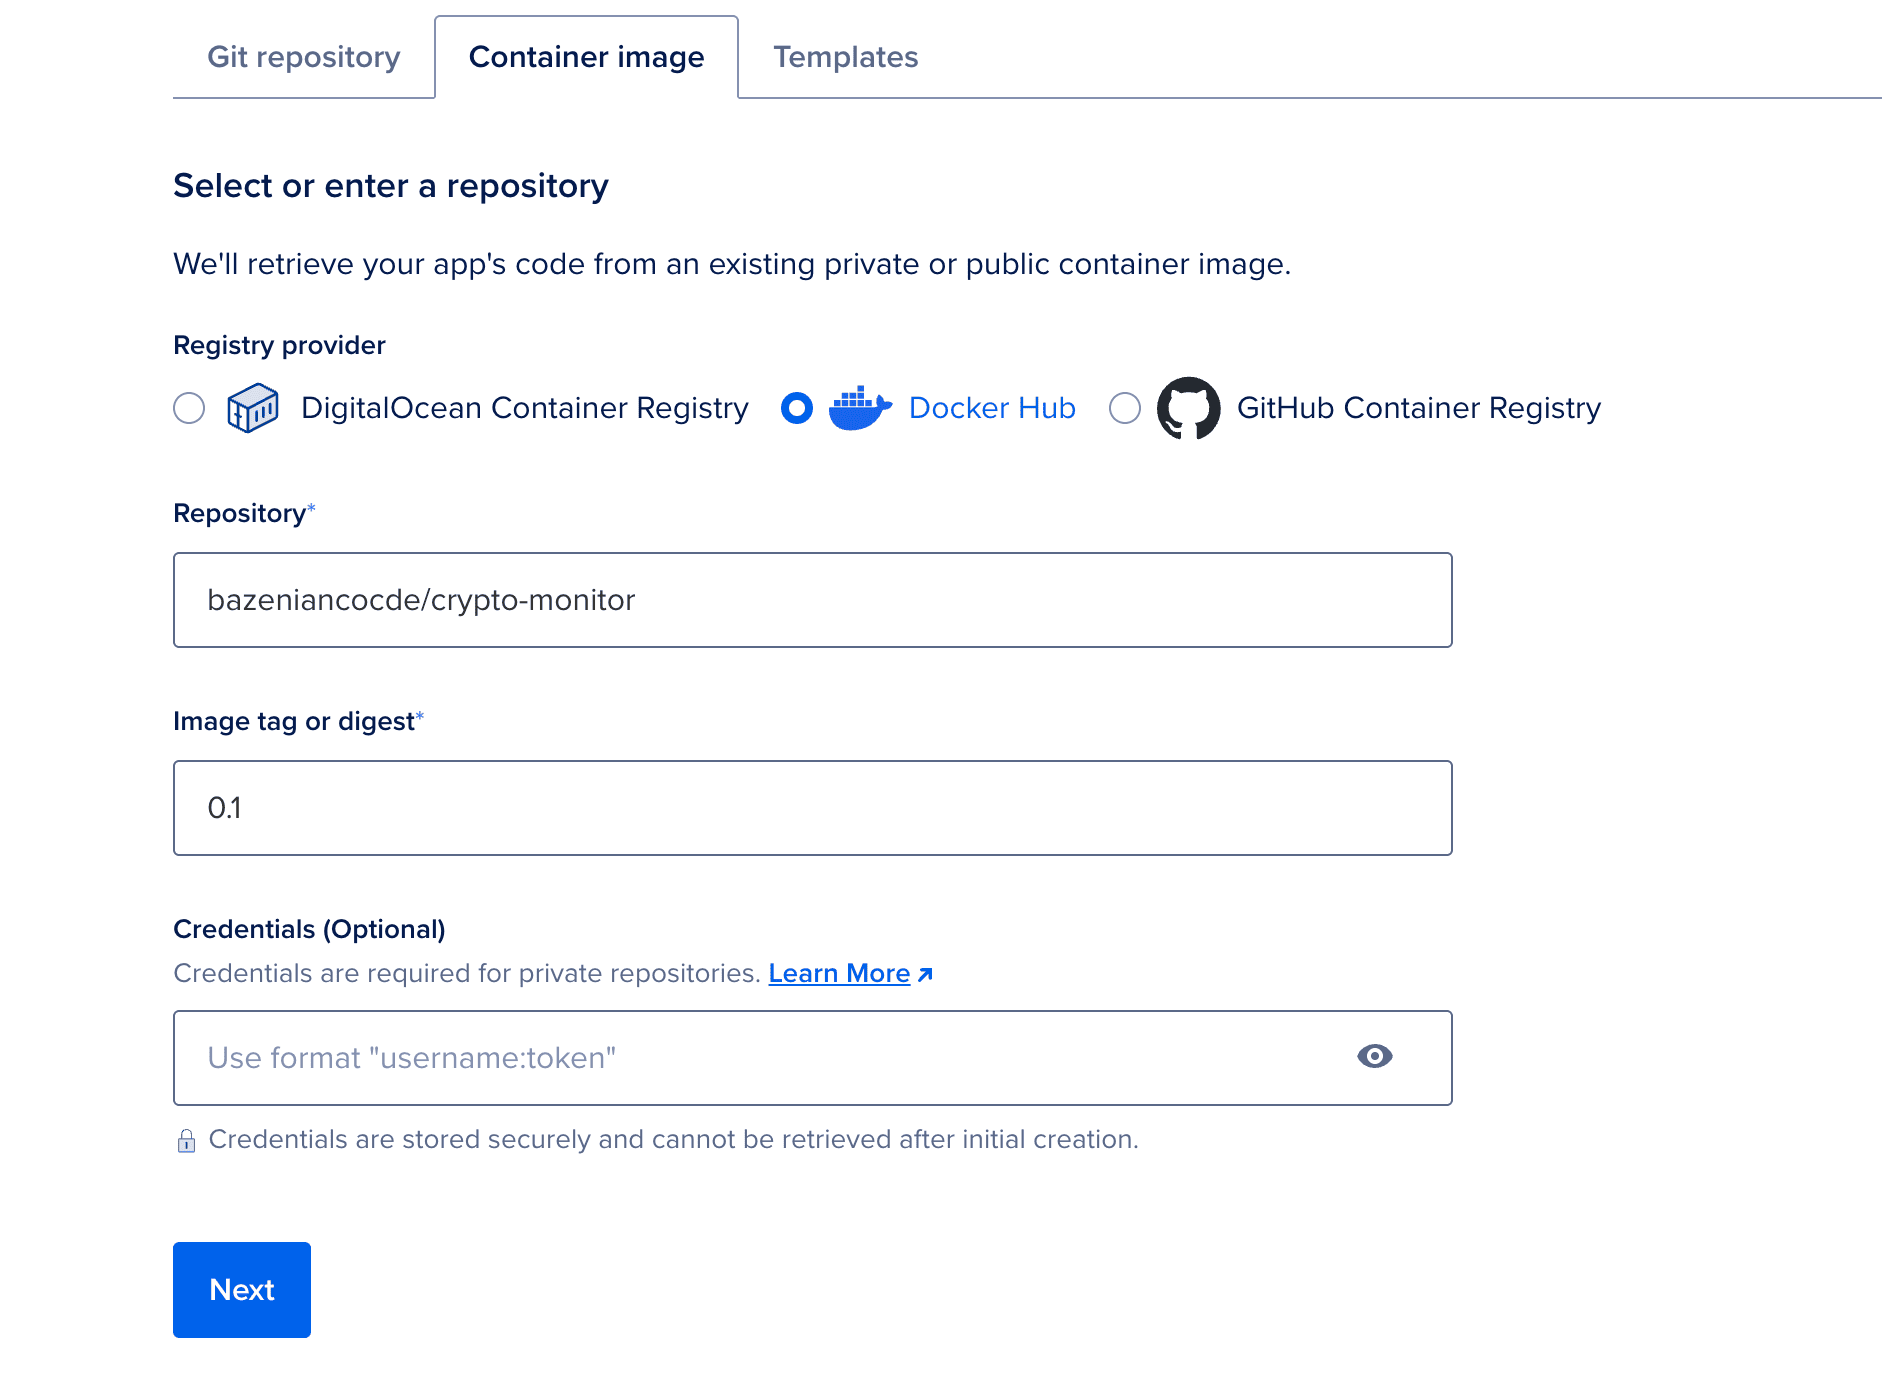
For this setup, the Container Image option was used. The platform pulls the image from Docker Hub and runs it as a managed service.
Choosing a Deployment Region
In general, the chosen region does not significantly affect the internal startup time of the JVM itself. The cold start process mainly depends on application initialization, dependency loading, and the runtime environment.
However, the region can still influence overall network performance. Applications deployed closer to their users usually experience lower latency because requests travel a shorter physical distance between the client and the server.
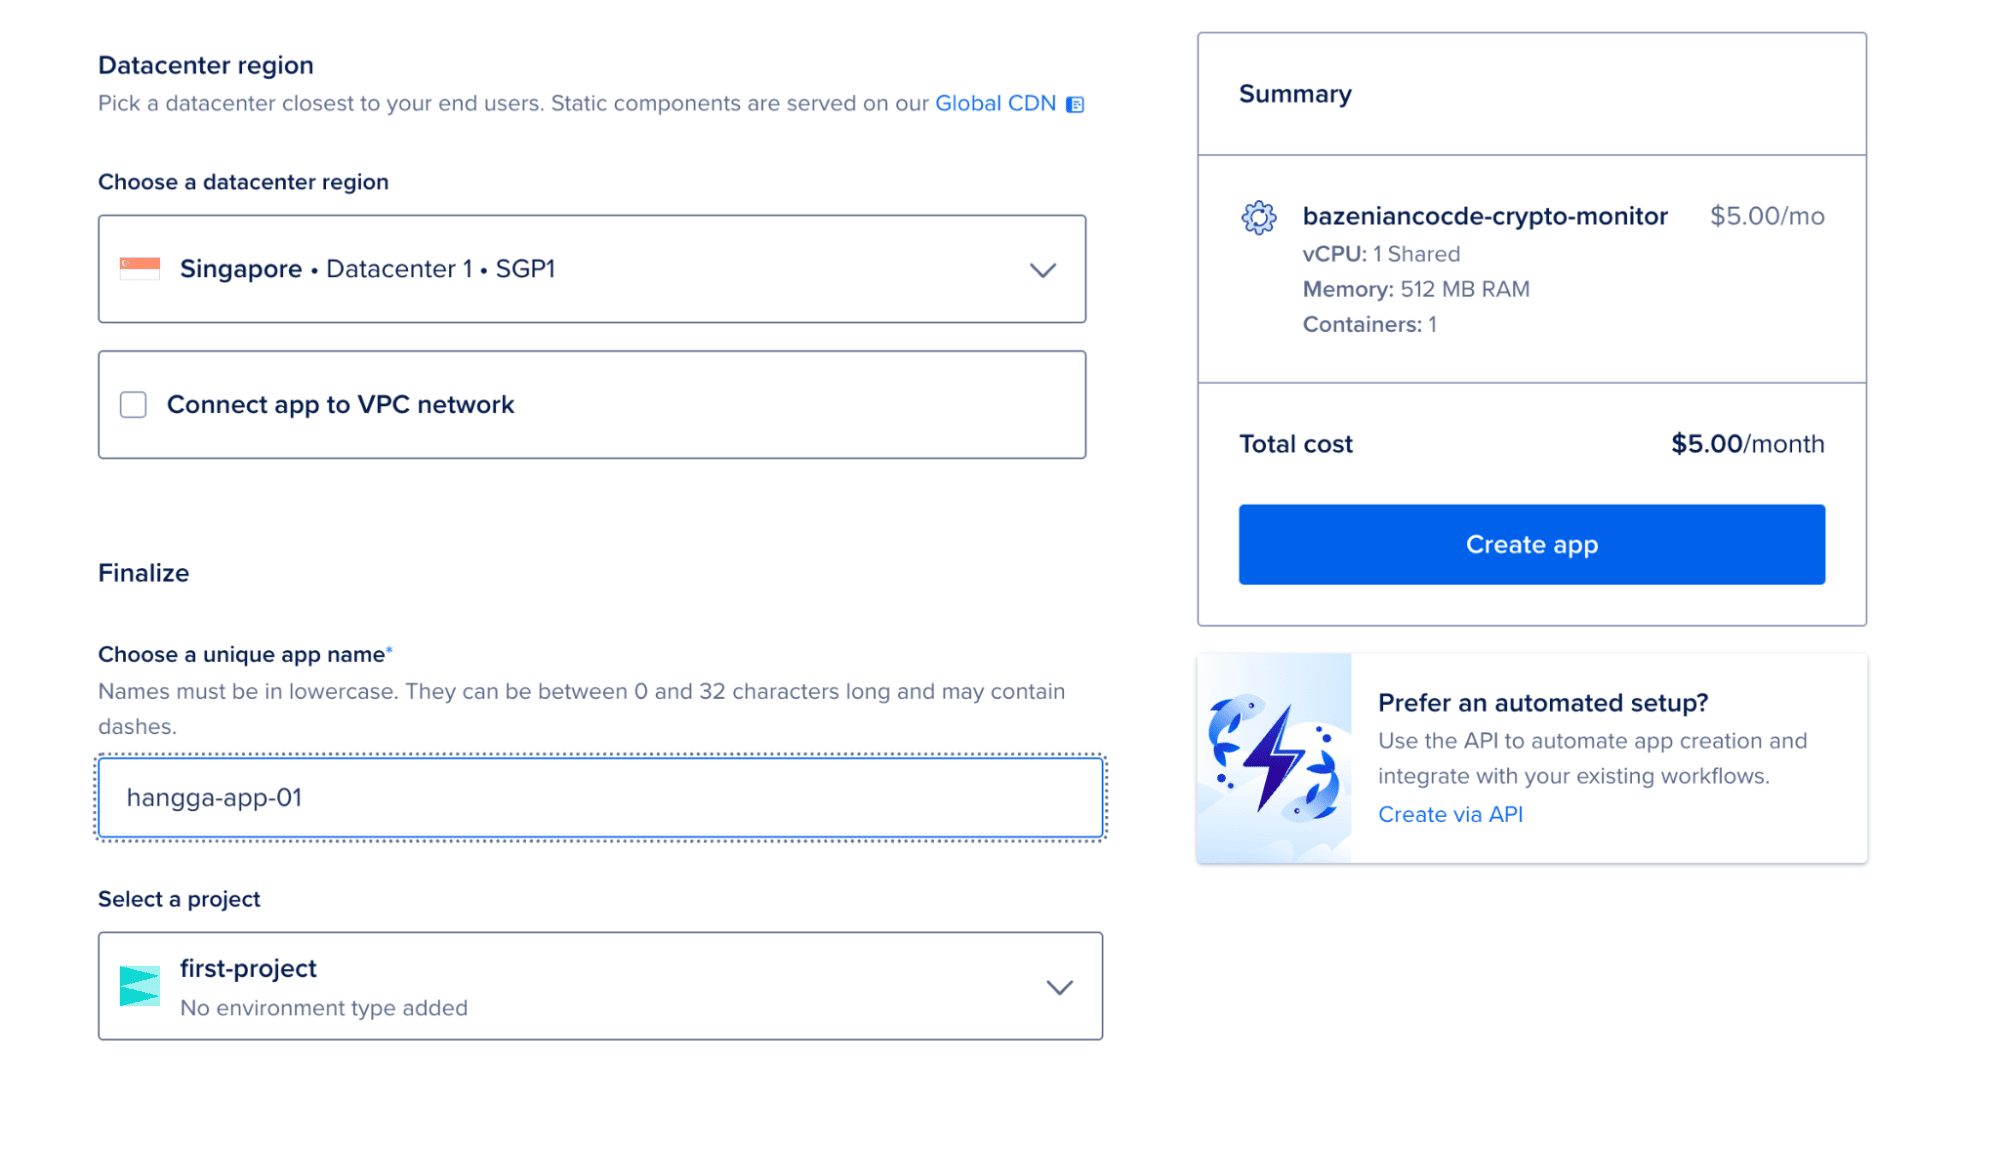
Since this experiment was conducted from Indonesia, the Singapore region was selected as the deployment location. This region hosts the closest DigitalOcean data center to most locations in Southeast Asia, which typically results in lower network latency compared to regions located farther away.
Selecting this region primarily ensures that the deployed service can be accessed with minimal network delay while allowing the experiment to observe the application’s behavior within a cloud environment.
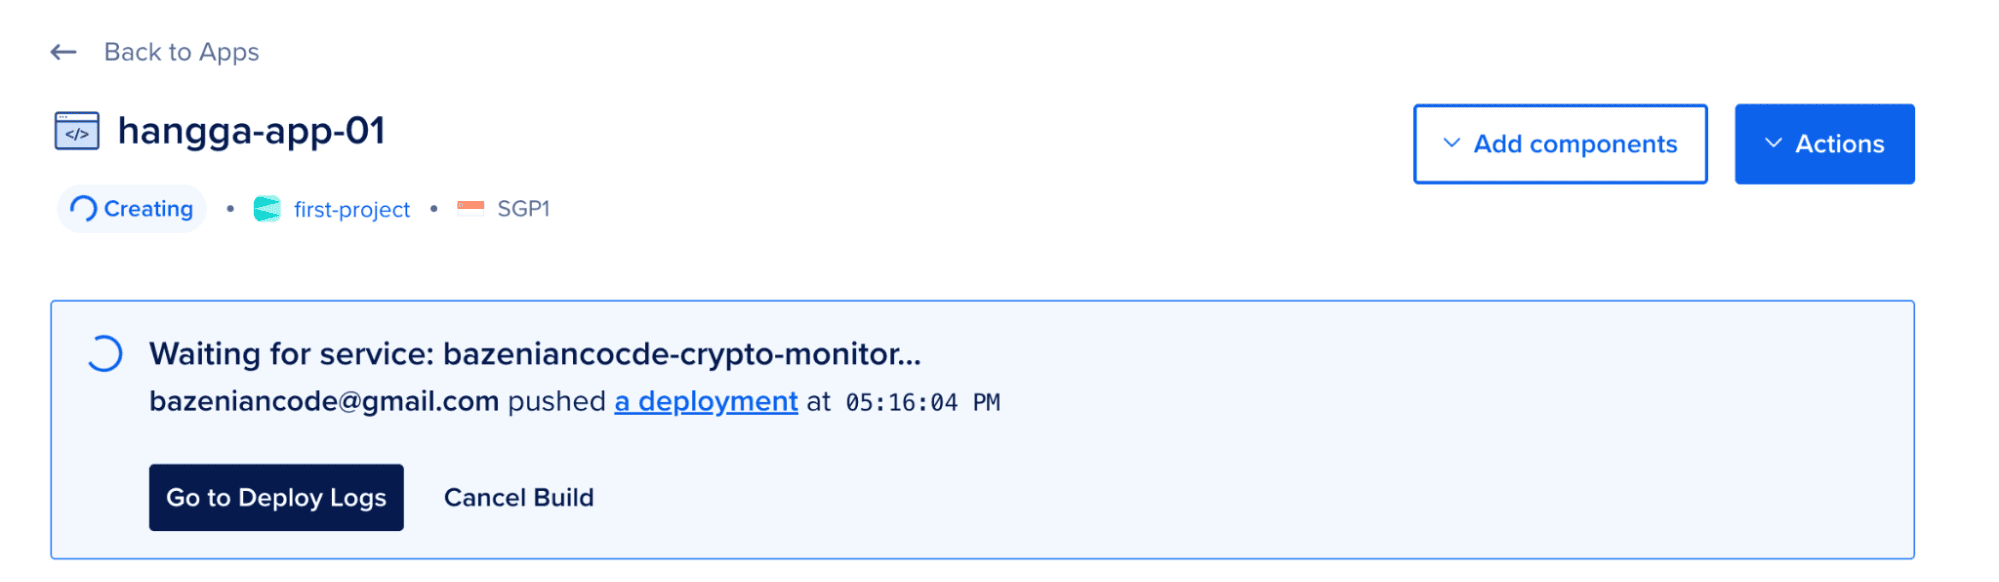
Once deployed, App Platform automatically provisions networking, assigns a public URL, and manages the runtime environment.
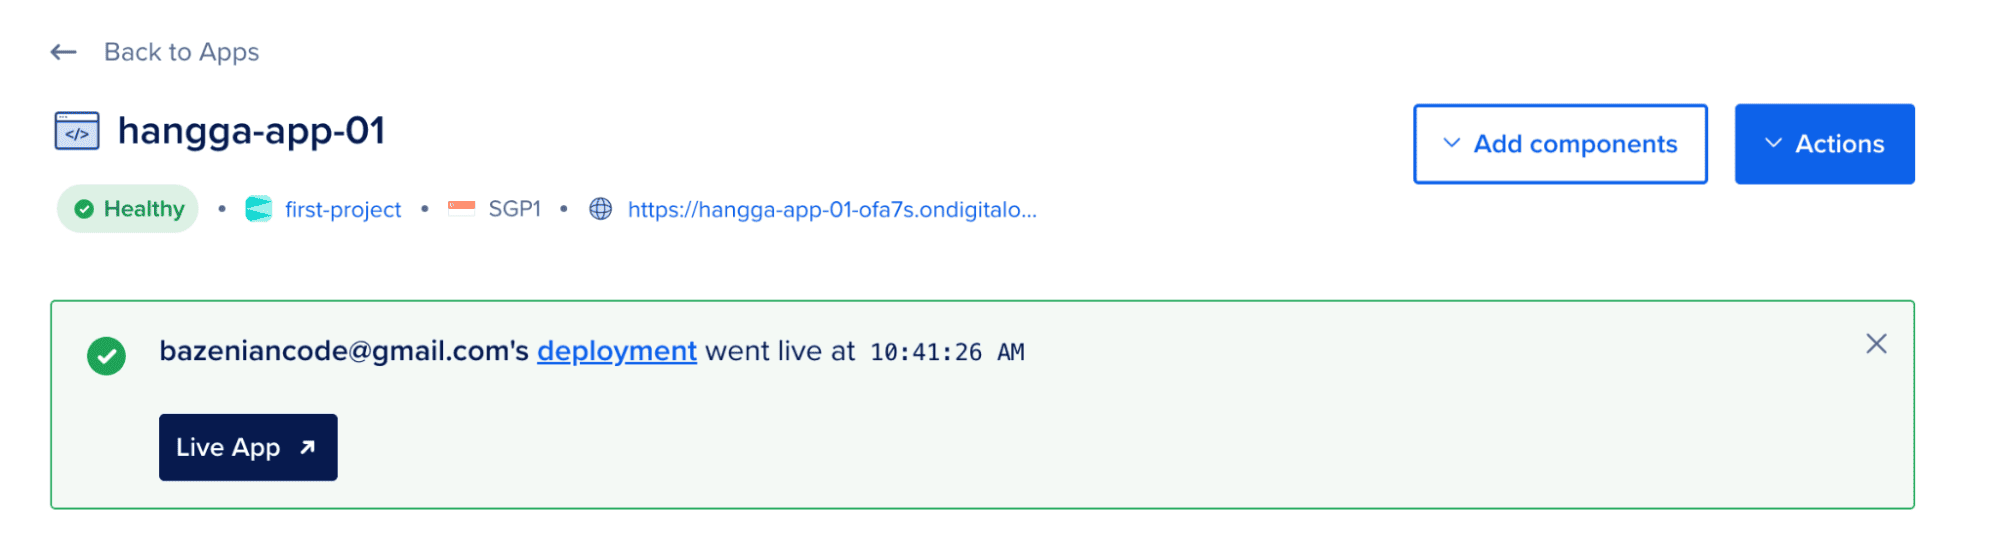
The API is live! Everything is running smoothly and ready for action.
Exploring App Platform Features
After deployment, App Platform provides several built-in tools that help observe how the service behaves in production.
These tools are especially useful when evaluating startup behavior and runtime performance.
Insight
The Insights panel provides basic runtime metrics such as CPU usage and memory consumption.
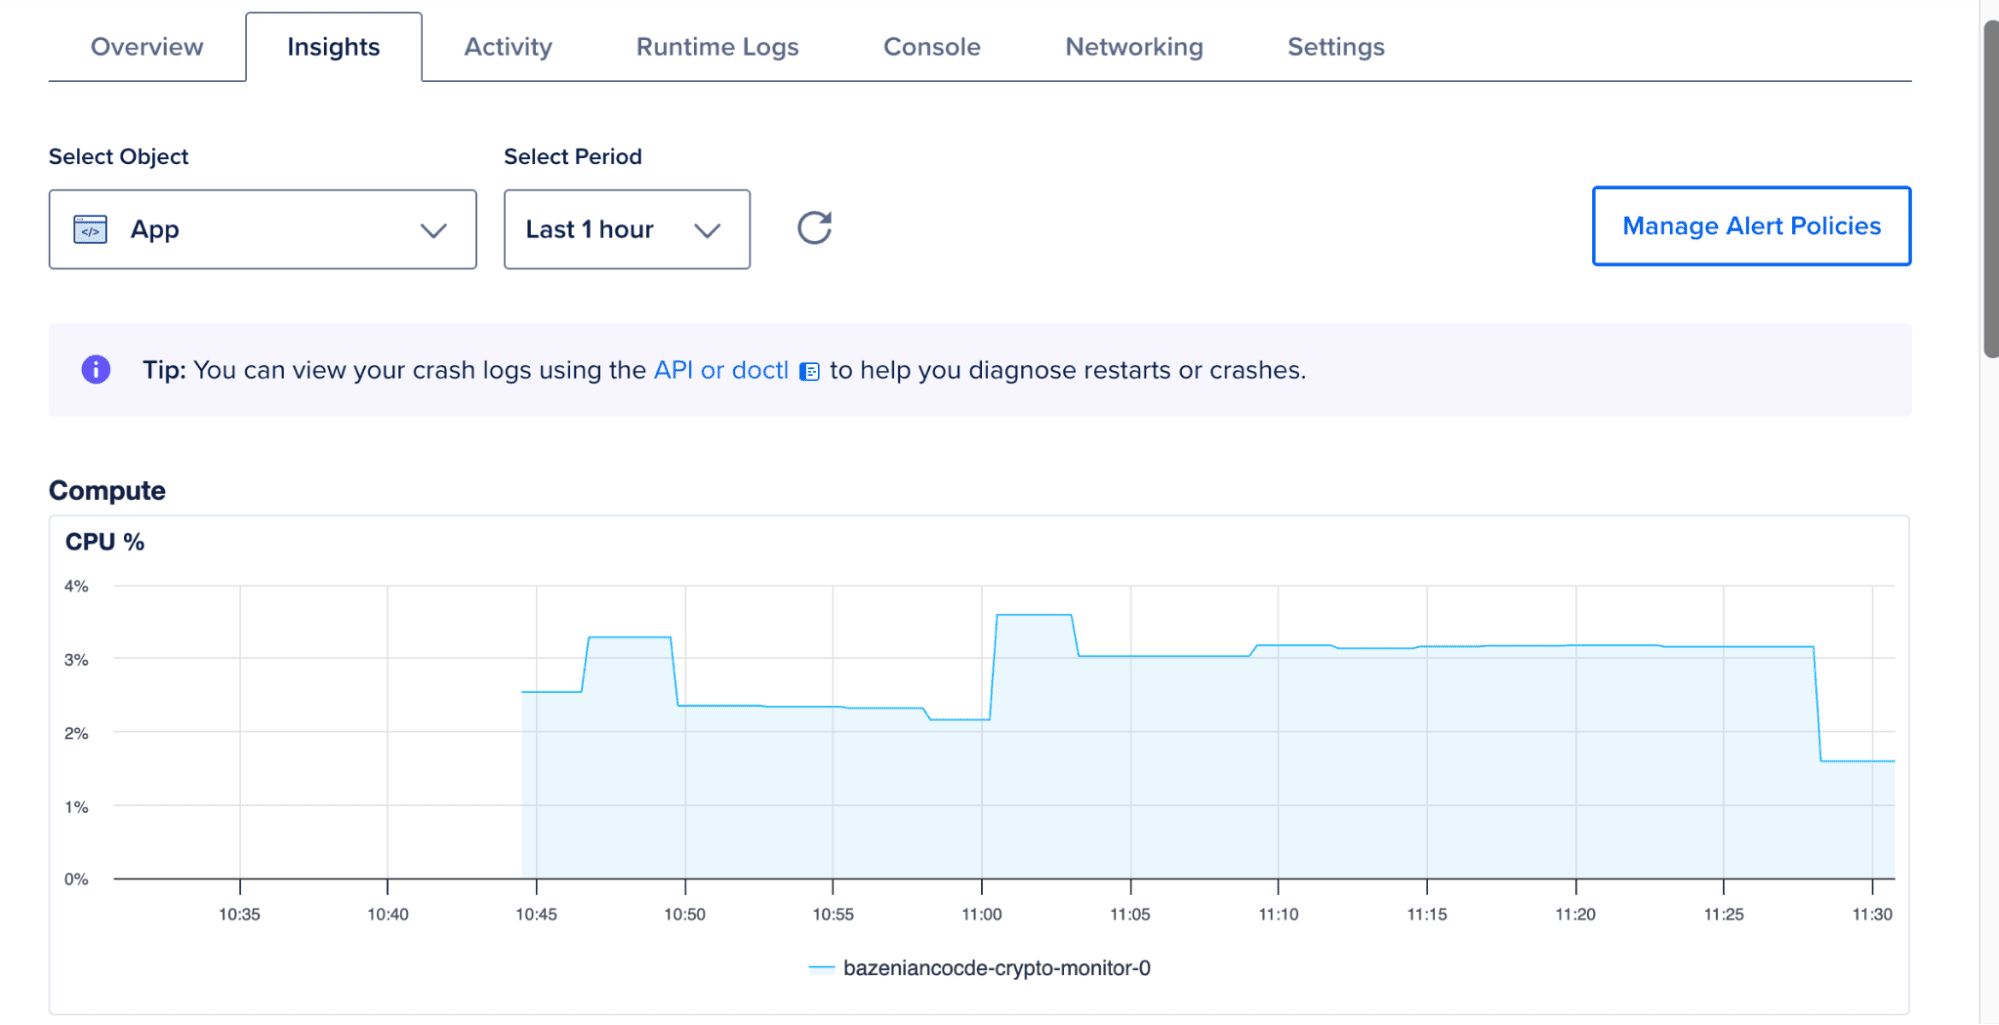
While not a full monitoring system, it offers a quick overview of how the application behaves under normal operation.
Runtime Log
The Runtime Logs view shows logs generated by the running container.
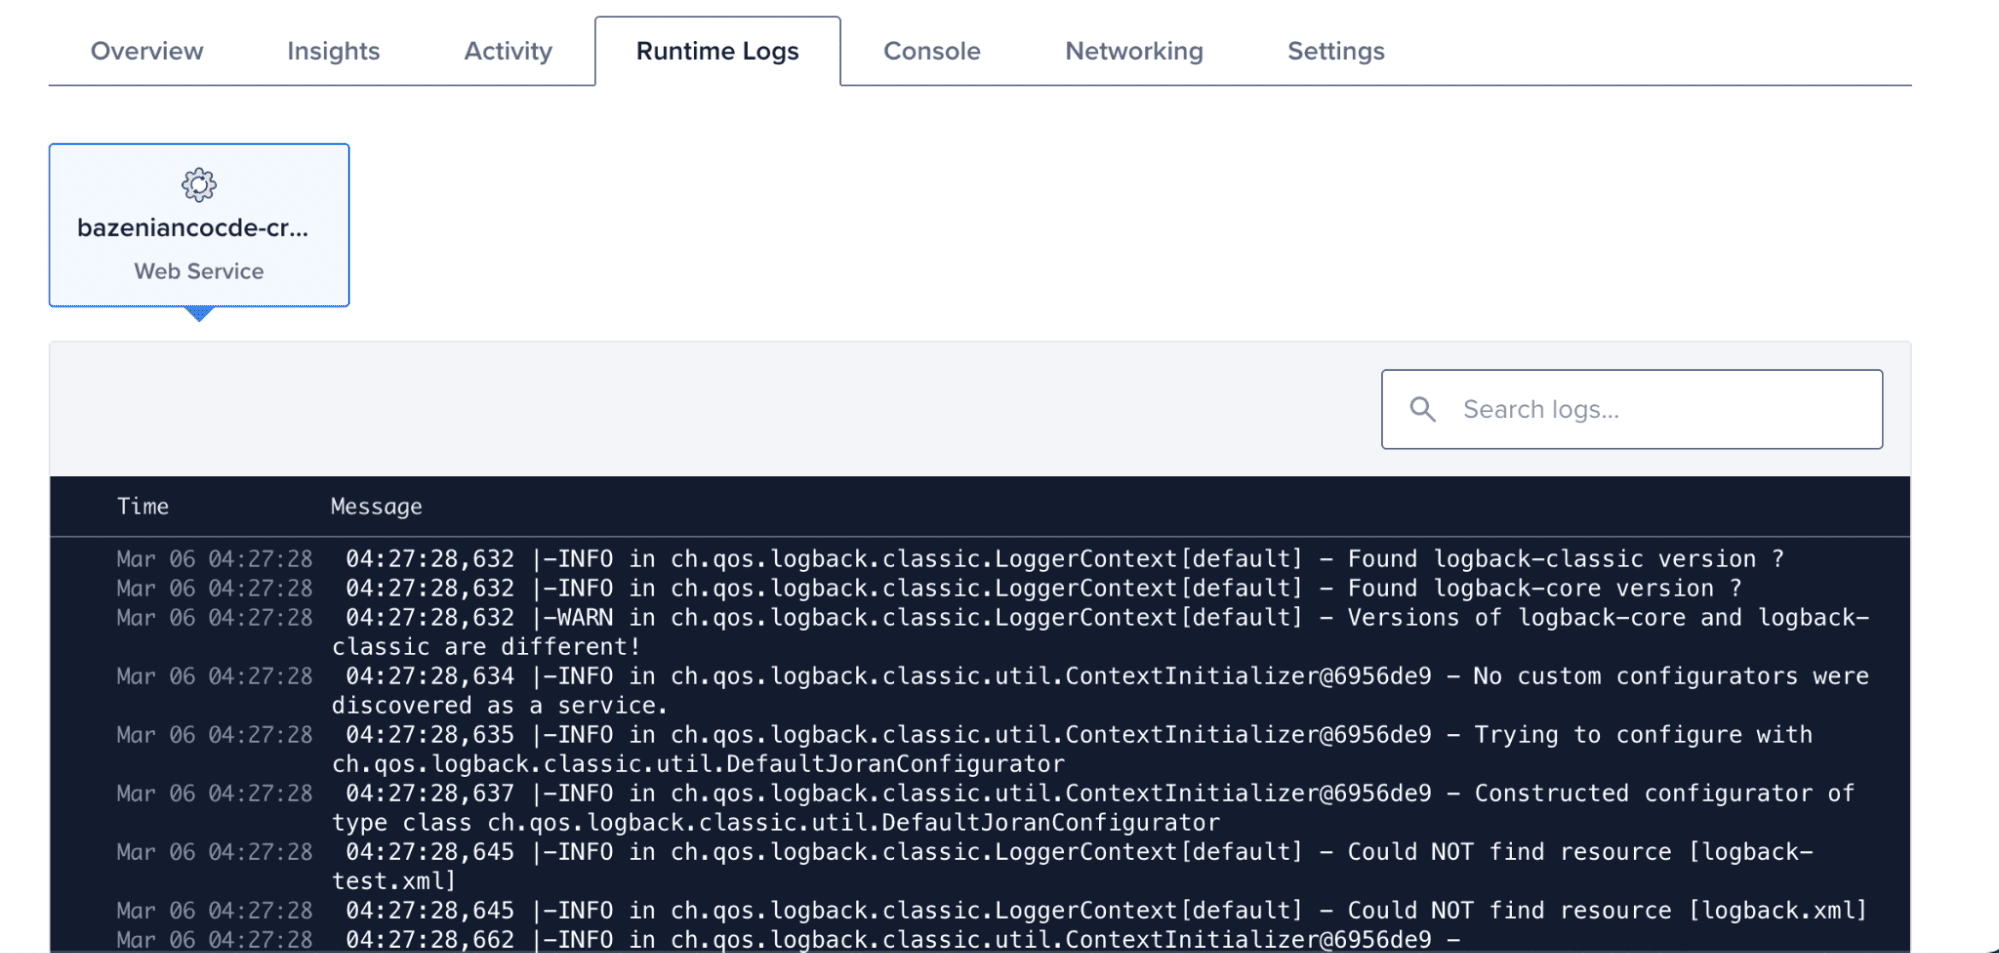
This helps confirm when the application starts and whether the initialization process completes successfully.
Activity
The Activity tab records deployment events and configuration changes.
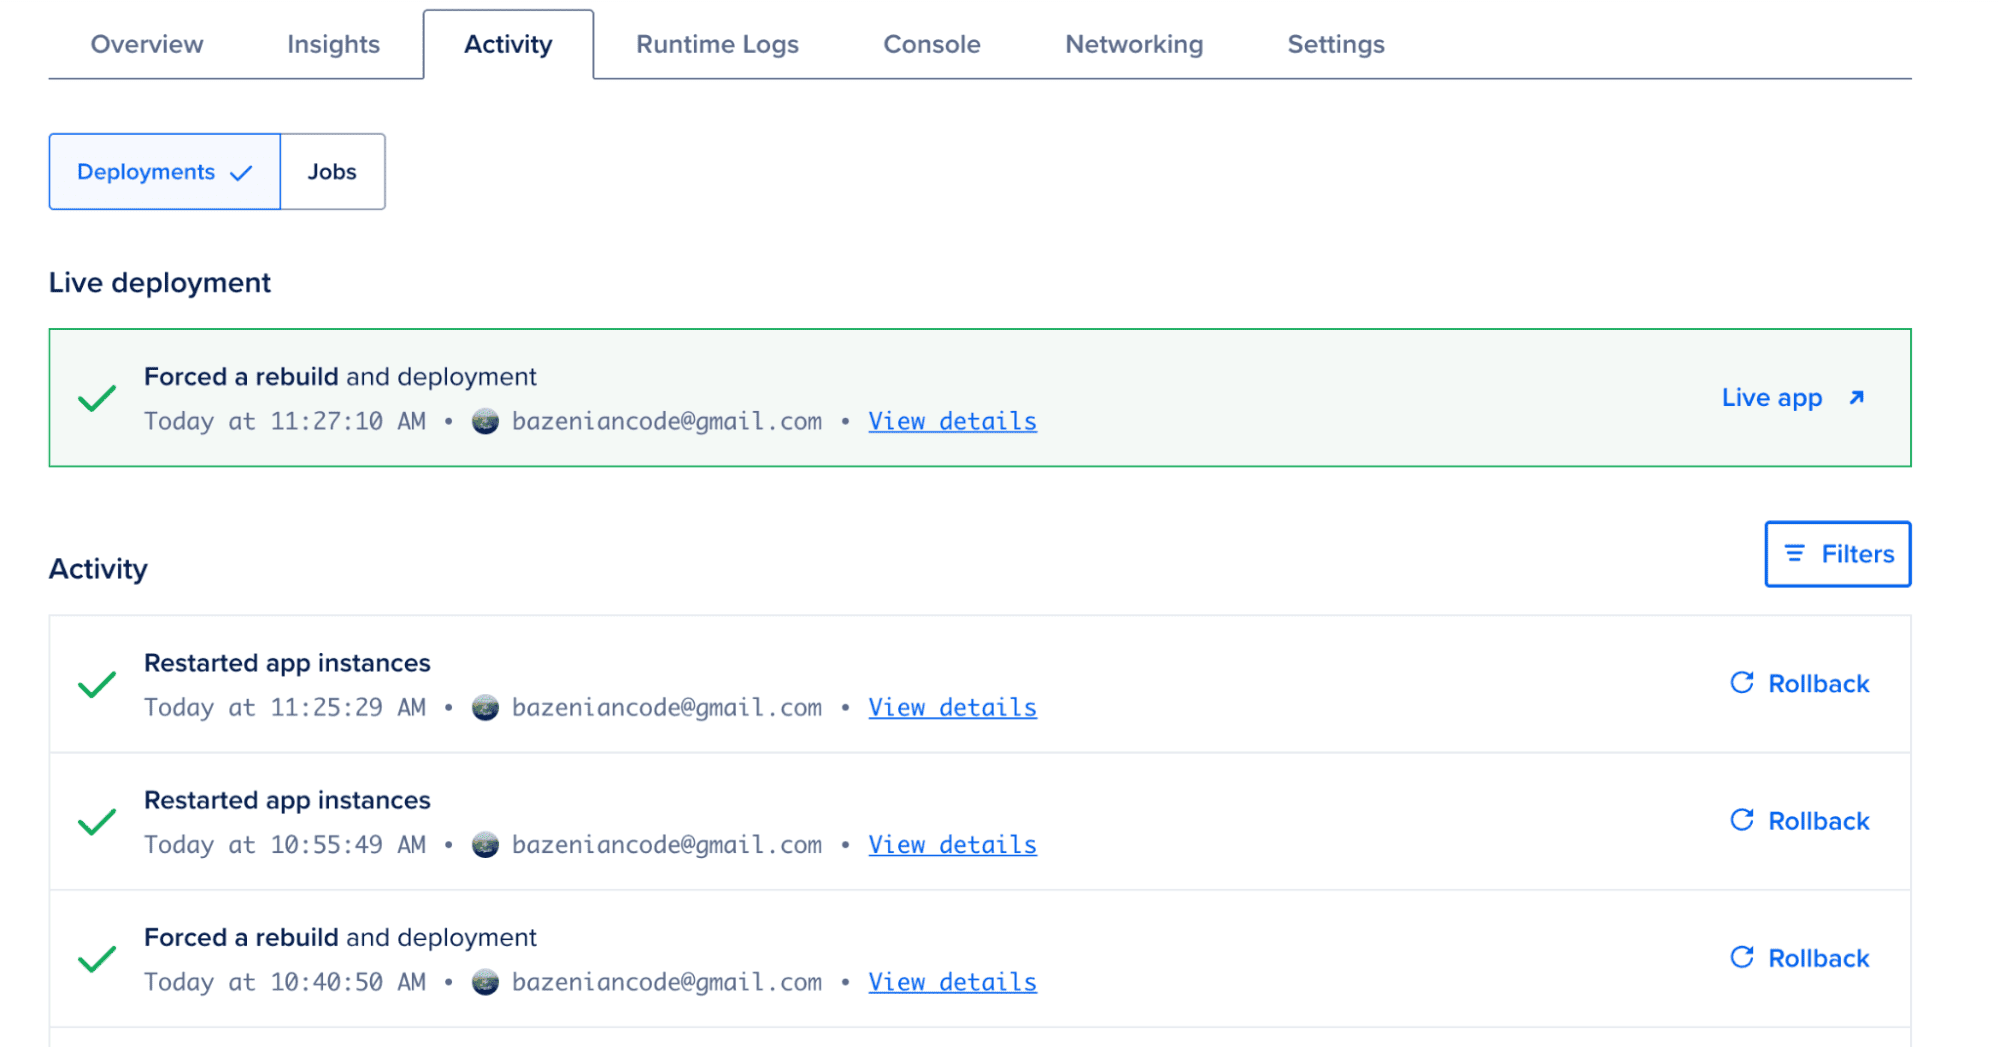
This timeline helps track when redeployments occur during testing.
FAQs
What is a cold start in a JVM/Kotlin application?
Cold start is the time an application takes to become ready to handle the first request after being launched. For the JVM, this includes loading classes, initializing the runtime, and executing startup code. Even a small delay (e.g., 300–500 ms) can be noticeable for services that need to respond instantly.
What causes cold starts in a Kotlin API?
The main cause is the number of classes the JVM must load at startup. Larger JAR files and complex dependencies increase load time. The server engine (e.g., Netty) also adds initialization overhead.
What optimizations were made to reduce cold starts?
Five main steps:
- Reduce JAR size by removing unused dependencies.
- Switch server engine from Netty to the lighter CIO.
- Disable Kotlin’s runtime assertions that aren’t strictly needed.
- Use Class Data Sharing (CDS) so the JVM loads classes faster.
- Use a minimal container (distroless) with JVM options optimized for quick startup.
Does JAR size affect cold start?
Yes. After dependency minimization, JAR size decreased from 17 MB to 13 MB. Reducing size helps speed up class loading, though the impact is not linear.
How much did switching from Netty to CIO improve startup time?
Average startup time dropped from 410 ms to 82 ms—an 80% improvement. CIO has a much smaller footprint and simpler initialization.
Does deployment region affect cold start?
Region does not impact JVM startup time but affects network latency between users and the server. Choose a region close to your audience for better responsiveness.
What monitoring features does App Platform offer?
- Insights: CPU and memory metrics.
- Runtime Logs: real-time application logs.
- Activity: deployment history and configuration changes.
Conclusion
Reducing cold starts in JVM-based applications is not about a single change, but a combination of targeted optimizations. In this article, we explored how startup latency in a Kotlin Ktor service can be analyzed and improved through practical steps such as reducing JAR size, switching server engines, and tuning JVM behavior.
Based on the results, the average startup time was reduced from approximately 410 ms to 82 ms—an improvement of nearly 80%. This demonstrates that even lightweight optimizations can have a significant impact when applied together.
While the exact results may vary depending on the application and environment, understanding how the JVM initializes and where time is spent during startup provides a strong foundation for making effective performance improvements.
For latency-sensitive services, especially those running in containerized or serverless environments, reducing cold starts can noticeably improve responsiveness and overall user experience.
Resources
- Ktor Documentation: ktor.io
- Ktor CIO Engine: klibs.io/package/io.ktor/ktor-server-cio
- Netty: netty.io
- SLF4J: slf4j.org
- DigitalOcean App Platform: digitalocean.com/products/app-platform
- Gradle Shadow Plugin: gradleup.com/shadow
- OpenJDK Class Data Sharing (CDS): docs.oracle.com/en/java/javase/17/vm/class-data-sharing.html
- Resilience4j: resilience4j.readme.io
Disclosure
Disclosure: This article was written as part of the Ripple Writers program with DigitalOcean. The author received compensation for producing this tutorial. The opinions and technical evaluations presented in this article are based on the author’s independent experimentation and experience.
 Porting an Old Delphi Project: Bringing CIH to the Browser with Vanilla JavaScript